
Demystifying Technical Analysis: Unveiling the Strategies and Tools for Stock Market Analysis
Discover the power of technical analysis in the stock market. Uncover the secrets behind price patterns, technical indicators, and volume analysis. Learn how to identify trends, support/resistance levels, and make informed trading decisions. Master the art of predicting price movements and maximizing your trading potential.
6/7/20232 min read

Technical analysis is a method used to evaluate and predict future price movements in financial markets, including the stock market. It relies on the analysis of historical price and volume data, as well as various technical indicators and chart patterns. The main premise of technical analysis is that historical price patterns can provide insights into future price behavior, allowing traders and investors to make more informed decisions.
Key Components of Technical Analysis:
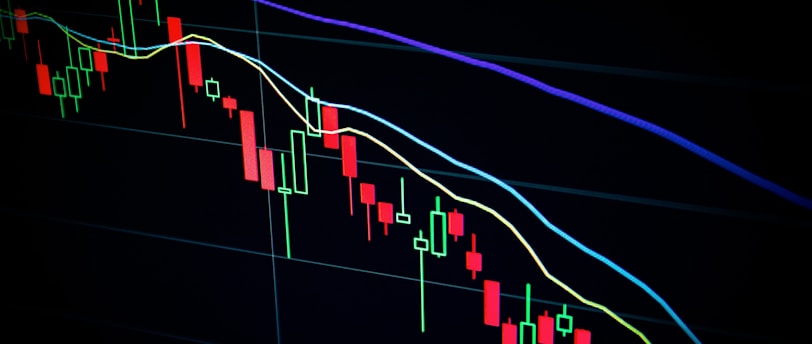
Price Patterns: Technical analysts study patterns in price charts, such as trends, support and resistance levels, and chart formations. These patterns can provide information about the direction and strength of market movements. Common patterns include head and shoulders, double tops/bottoms, triangles, and flags.
Technical Indicators: Various technical indicators are used to supplement price analysis. These indicators are mathematical calculations based on historical price and volume data and can help identify potential buying or selling opportunities. Examples of popular technical indicators include moving averages, relative strength index (RSI), MACD (Moving Average Convergence Divergence), and stochastic oscillators.
Volume Analysis: Volume refers to the number of shares traded in a particular security over a given period. Technical analysts consider volume as a confirmation tool for price movements. Higher trading volume during price advances suggests strong buying interest, while higher volume during price declines indicates increased selling pressure.
Support and Resistance Levels: Support levels are price levels where buying interest is expected to be strong, preventing the price from declining further. Resistance levels, on the other hand, are price levels where selling pressure is expected to be significant, preventing the price from rising further. Traders often use these levels to determine potential entry or exit points.
Trend Analysis: Technical analysts study trends to determine the overall direction of price movements. Trends can be classified as upward (bullish), downward (bearish), or sideways (consolidation). Identifying the primary trend helps traders align their positions with the broader market direction.
Limitations of Technical Analysis:
Fundamental Factors: Technical analysis focuses solely on price and volume data, ignoring fundamental factors such as earnings, company performance, and economic indicators. Fundamental analysis complements technical analysis by providing insights into the underlying value of a stock or asset.
Market Efficiency: Critics argue that all available information is already reflected in market prices, making it difficult to consistently profit solely based on historical price patterns and indicators.
Subjectivity: Technical analysis requires interpretation and subjective decision-making. Different analysts may interpret the same chart pattern or indicator differently, leading to variations in trading strategies.
Limited Predictive Power: While technical analysis can provide insights into potential price movements, it does not guarantee future outcomes. Market dynamics can change unexpectedly, rendering historical patterns less reliable.
Conclusion: Technical analysis is a popular approach used by traders and investors to analyze and forecast price movements in the stock market. By studying historical price patterns, technical indicators, and chart formations, analysts aim to identify trends, support/resistance levels, and potential buying or selling opportunities. While technical analysis has its limitations, it remains a valuable tool for market participants seeking to gain insights and make informed decisions in the dynamic world of trading and investing. Combining technical analysis with fundamental analysis can provide a more comprehensive understanding of market dynamics and improve decision-making.